Pearson Edexcel · A-Level · Mathematics
Course version: 9MA0 · Version from Mar 2026
Understand and use graphs of functions; sketch curves defined by simple…
Full specification wording
Algebra and functions: 2.7 Understand and use graphs of functions; sketch curves defined by simple equations including polynomials, the modulus of a linear function, y = a/x and y = a/x² (including their vertical and horizontal asymptotes); interpret algebraic solution of equations graphically; use intersection points of graphs to solve equations. Understand and use proportional relationships and their graphs.
Sketching shows shape, intercepts, turning points, asymptotes and behaviour as x → ±∞.
Checked against the Pearson Edexcel 9MA0 specification (opens in a new tab) on .
- Point 7 of 11
- 4 key terms
Study notes
From the checked teaching notes for this specification point.
The idea
Sketching shows shape, intercepts, turning points, asymptotes and behaviour as x → ±∞. For a polynomial like y = x³ − 3x, find intercepts, differentiate for stationary points, and note opposite end behaviour. For y = |mx + c|, sketch the V-shape by reflecting the negative part of the line in the x-axis. For y = a/x, the axes are asymptotes (x = 0, y = 0), with branches in opposite quadrants. For y = a/x², branches lie on opposite sides of the vertical asymptote x = 0, but on the same side of the horizontal asymptote y = 0 (both above the x-axis if a > 0). Solving f(x) = g(x) graphically means reading x-coordinates of intersection points. Proportional relationships give straight-line graphs through the origin: y = kx.
What earns the marks
- Sketch shows correct general shape and labels all axis intercepts found by setting x = 0 or y = 0.
- Stationary points of a polynomial are located by solving f′(x) = 0 and their coordinates labelled.
- Modulus graph y = |mx + c| is drawn as a V with vertex where mx + c = 0, and the negative branch reflected above the x-axis.
- For y = a/x, both axes are drawn as asymptotes and the two branches occupy opposite quadrants.
- For y = a/x², the vertical asymptote x = 0 and horizontal asymptote y = 0 are shown, with branches on opposite sides of the y-axis but the same side of the x-axis.
- Intersection points of two curves are used to state the x-values solving f(x) = g(x), with the number of intersections matching the number of solutions.
- A proportional relationship is identified as y = kx and its graph drawn as a straight line through the origin with gradient k.
Common mistakes and how to put them right
Drawing y = a/x² with branches in opposite quadrants.
Put it right by testing x = 1 and x = −1, which give the same positive value when a > 0, so both branches lie on the same side of the x-axis.
Treating an asymptote as a line the curve crosses.
Put it right by checking that the function is undefined at the vertical asymptote and tends to the horizontal value without reaching it.
Reading only the y-coordinate at an intersection to solve f(x) = g(x).
Put it right by stating the x-coordinate, since the solution of the equation is the input value.
Assuming every straight-line graph represents proportion.
Put it right by checking the line passes through the origin before writing y = kx.
Exam tips
- Label asymptotes with their equations, for example x = 0 and y = 0, because unlabelled dashed lines lose clarity.
- Substitute one positive and one negative x-value to confirm the quadrant placement of reciprocal and reciprocal-square branches.
- When a question says 'hence' or 'graphically', link the number of intersection points explicitly to the number of solutions.
- Check whether the domain is restricted; a sketch over a given interval should stop at the endpoints rather than extend indefinitely.
Try the lesson
The start of the Algebra and functions: 2.7 Understand and use graphs of functions; sketch curves defined by simple equations including polynomials, the modulus of a linear function, y = a/x and y = a/x² (including their vertical and horizontal asymptotes); interpret algebraic solution of equations graphically; use intersection points of graphs to solve equations. Understand and use proportional relationships and their graphs. lesson, made from checked teaching notes for this specification point.
Have a go first
The curve y = 6/x has a horizontal asymptote. State the equation of this asymptote.
Listen
Sketching shows shape, intercepts, turning points, asymptotes and behaviour as x → ±∞. For a polynomial like y = x³ − 3x, find intercepts, differentiate for stationary points, and note opposite end behaviour. For y = |mx + c|, sketch the V-shape by reflecting the negative part of the line in the x-axis. For y = a/x, the axes are asymptotes (x = 0, y = 0), with branches in opposite quadrants. For y = a/x², branches lie on opposite sides of the vertical asymptote x = 0, but on the same side of the horizontal asymptote y = 0 (both above the x-axis if a > 0). Solving f(x) = g(x) graphically means reading x-coordinates of intersection points. Proportional relationships give straight-line graphs through the origin: y = kx. A strong answer earns marks for these points. Sketch shows correct general shape and labels all axis intercepts found by setting x = 0 or y = 0. Stationary points of a polynomial are located by solving f′(x) = 0 and their coordinates labelled. Modulus graph y = |mx + c| is drawn as a V with vertex where mx + c = 0, and the negative branch reflected above the x-axis. For y = a/x, both axes are drawn as asymptotes and the two branches occupy opposite quadrants. A common slip: Drawing y = a/x² with branches in opposite quadrants. Instead, testing x = 1 and x = −1, which give the same positive value when a > 0, so both branches lie on the same side of the x-axis. Exam tip: Label asymptotes with their equations, for example x = 0 and y = 0, because unlabelled dashed lines lose clarity.
See it

Key words
Say what each word means before you turn the card.
Asymptote
Try answering aloud or in your head before turning the card.
Modulus graph
Try answering aloud or in your head before turning the card.
Intersection points
Try answering aloud or in your head before turning the card.
Proportional relationship
Try answering aloud or in your head before turning the card.
See every definition
- Asymptote
- A line that the curve approaches but does not cross, such as the axes for y = a/x.
- Modulus graph
- A V-shape drawn by reflecting the negative part of the line in the x-axis, with vertex where mx + c = 0.
- Intersection points
- Points where two curves meet, whose x-coordinates give the solutions of f(x) = g(x).
- Proportional relationship
- A relationship giving a straight-line graph through the origin, written as y = kx.
Label the diagram
Some boxes have lost their names. Pick the right name for each number.
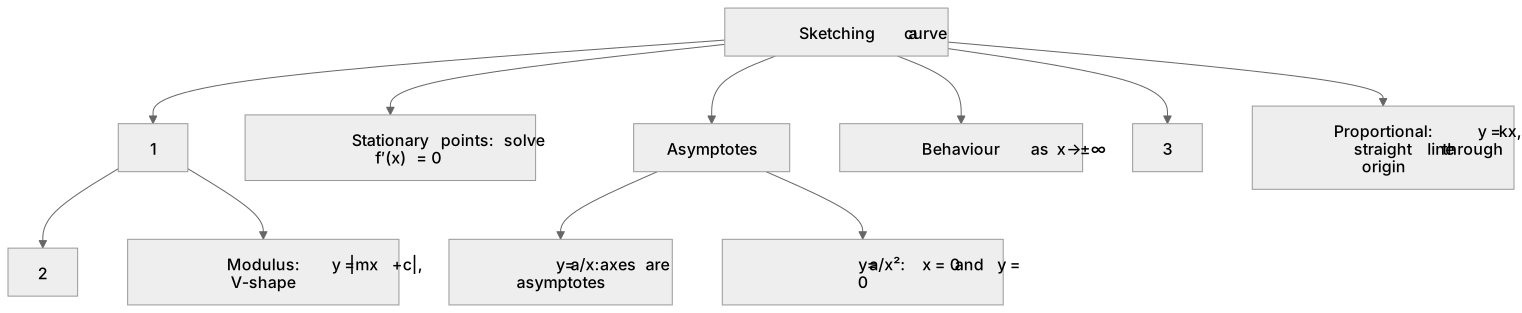
1Box 1
2Box 2
3Box 3
There is more to this lesson
The full lesson goes on to check your understanding and help you earn the marks. Create a free account to carry on, with your progress saved.
A week of Premium from your first lesson · Then the free plan continues · No card, no charge
Test your understanding of Algebra and functions: 2.7 Understand and use graphs of functions; sketch curves defined by simple equations including polynomials, the modulus of a linear function, y = a/x and y = a/x² (including their vertical and horizontal asymptotes); interpret algebraic solution of equations graphically; use intersection points of graphs to solve equations. Understand and use proportional relationships and their graphs.
Active recall beats re-reading. Take an instant quiz now to test what you’ve learned and lock it into long-term memory.
A week of Premium from your first lesson · Then the free plan continues · No card, no charge